MR - Latest Trends
Short term rates cheap
Thursday 2nd of July 2009

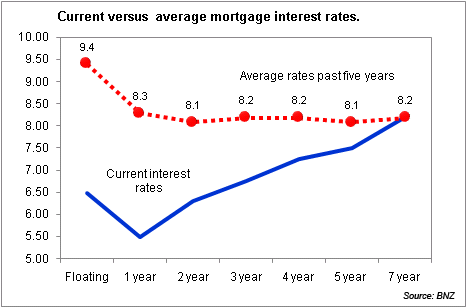
Often it is useful to put home loan rates into an historical context to understand what looks the best. This graph shows where interest rates are now compared to their historical average over the past five years. Clearly floating and one year rates are significant...
Want to read the full article?
Click the button below to subscribe and will have unlimited access to full article and all other articles on the site.
Latest News
1 min read
1 min read
1 min read
1 min read
Latest Comments
[OPINION] Tax Efficiency vs. Real Returns: Are you being penny wise and pound foolish?
On a slightly different matter.
A friend of mine owned a business and made enough to afford to purchase a property (office cum warehouse) for his business. I asked why don't he buy instead of rent?
He said his accountant told him to rent, don't buy, to reduce his tax. He heeded his accountant's advice. 30 years later, he retired, his cash savings was nowhere near the value of the property he didn't buy.
Had he purchased the property, at least he has two options - rent out the property for his retirement income or sell it and realise the capital gain (no tax) which far exceeds the tax savings during his business trading years. Penny wise pound foolish, eh?
1 week ago W K
[OPINION] Tax Efficiency vs. Real Returns: Are you being penny wise and pound foolish?
Great article and points made, Andy.
I had to explain recently and demonstrate these very points to a very senior professional trustee. I was instructed by the trustee to "make the portfolio tax efficient." I guess, from a CA point of view, that made sense to her.
As luck would have it, the newly appointed CA completing the accounts didn't quite see it that way and agreed with my advice and your article.
1 week ago John Milner
Lessons for life insurers from 1918
Remember that New Zealand did not have bodies overwhelming morgues in the midst of the pandemic so we didn't see a spike in deaths - unlike a lot of other countries. Hence no panic to get cover.
1 week ago Mark Stone
Competing with fintechs the way to go
If an adviser has their own FAP license, why would they risk having their client’s data (basically their whole business) held in an aggregator owned CRM?
1 week ago Valkyrie Vulcan
Should KiwiSaver hardship applications be centralised?
It should be that onerous. It's a retirement scheme.
not a fix the car scheme
not a bail out your bad choices scheme
the temptation for it to become so grows as balances grow. And KiwiSaver reules must resist it.
Every year there will be a new record for withdrawals, because there will be more in it to take, and more people looking to use it.
That's not a failure, that means it works.
2 weeks ago Regan Thomas


![[OPINION] Tax Efficiency vs. Real Returns: Are you being penny wise and pound foolish?](https://goodreturns.publit.io/file/c_fill,w_300,h_200/eb495911-87ec-46c6-9a16-6eeb5c81e7fb-9.webp)


