


MR - Latest Trends
The big tick
Thursday 22nd of October 2009
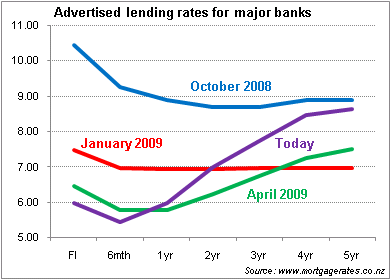
Following the latest round of rate hikes, the above yield graph illustrates the amount of upward movement made to long-term fixed rates this year, more particularly the past six-months, and it also shows the yo-yo affect as the rates are nearly back to where they were this time last year.
The graph also shows the huge drop in floating rates in the past year and the obvious place to be in the home loan market is still floating or on a short-term basis.
Want to read the full article?
Click the button below to subscribe and will have free unlimited access for a limited time to full article and all other articles on the site.
You will also be able to comment on articles on Good Returns.
Latest News



![[The Wrap] What the heck is happening at the FMA?](https://goodreturns.publit.io/file/c_fill,w_300,h_200/a6c3bc06-6401-44de-96e2-286c090e132d.jpg)

1 min read
1 min read
1 min read
1 min read